Are gas prices affected by the sitting US President (Under Construction, testing html view)
Gas Prices in USA, historical analysis
This report is intended to review gas prices in the USA historically for comparison against various claims.
One such claim is that the sitting US President has a direct affect on gas prices.
Data from the EIA - US Energy Information Administration
This dataframe set GasPrices_eia_prices_1970_2022 comes from the EIA website as a downloadable CSV.
The EIA provides an FAQ for using the data, which includes instructions to download the CSV and for a reference Excel document that helps with conversion.
“To obtain the historical prices from the SEDS data, use the CSV file for All States—Prices. In the file, the code for gasoline prices for the transportation sector, in $/MMBtu, is: State Abbreviation (in column A) and MGACD (in column B). For example, the code for Alaska is AK—MGACD. Those prices, in $/MMBtu, can be converted to approximate dollars per gallon using the heat contents in Table A3 Petroleum consumption and fuel ethanol. There are 42 U.S. gallons in a barrel.”
The CSV is downloaded from > Section: Prices and expenditures > Subsection: All price and expenditure estimates > SubSubsection: Prices > 1970-2022 > XLSX CSV ZIP
The following shows the barrel prices falling sharply well before 2016’s national election, and remaining relatively stable until after the pandemic crashes of 2020.
```{python}import pandas as pd
import
matplotlib.pyplot as
plt

# Path to the CSV file

file_path = 'C:/Users/dwolfe/Documents/Demo_Skills_SampleCode/Projects/National_Market_Markers/_dataframes/GasPrices_eia_prices_1970_2022.csv'

# Read the CSV file

df = pd.read_csv(file_path)

# Filter rows where 'MSN' column contains 'MGACD'

filtered_df = df[df['MSN'].str.contains('MGACD', case=False, na=False)]

# Calculate the average for each year for the
filtered data

average_prices = filtered_df.iloc[:, 3:].mean()  # Assumes year data starts at the 4th column

# Create a line plot

plt.figure(figsize=(10, 5))  # Set the
figure size

plt.plot(average_prices.index,
average_prices.values, marker='o')  # Plot the
average prices

plt.title('Average
Gas Prices Over Years for MGACD')  # Add a title

plt.xlabel('Year')  # Add x-axis label

plt.ylabel('Average
Price')  # Add y-axis label

plt.grid(True)  # Add a grid

plt.xticks(rotation=45)  # Rotate x-axis
labels for better readability

plt.tight_layout()
# Adjust layout to make room for the
rotated x-axis labels

plt.show()  # Display the plot```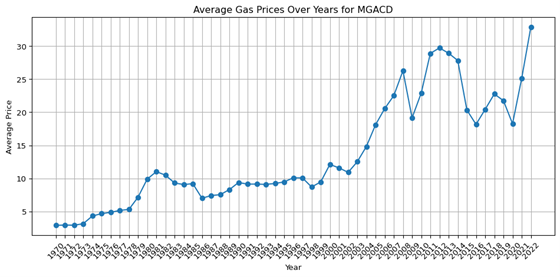
Data from Our World in Data
Our World in Data provides an international dataset to review.
This dataframe set GasePrices_OWD_crude-oil-prices.csv comes from the Our World in Data website as a downloadable CSV.
“Data Page: Oil price - Crude prices since 1861”, part of the following publication: Hannah Ritchie, Pablo Rosado and Max Roser (2023) - “Energy”. Data adapted from Energy Institute. Retrieved from https://ourworldindata.org/grapher/crude-oil-prices [online resource]
These international crude oil prices show the same trends, clearly indicating that the US President is unrelated to gas prices.
```{python}import pandas as pd
import
matplotlib.pyplot as
plt

# Path to the CSV file

file_path = 'C:/Users/dwolfe/Documents/Demo_Skills_SampleCode/Projects/National_Market_Markers/_dataframes/GasPrices_owd_intl_1861_2023.csv'

# Read the CSV file

df = pd.read_csv(file_path)

# Display the first few rows to verify the data

print(df.head())

# Filter data for years 1970 to 2023

filtered_df = df[(df['Year'] >= 1970)
& (df['Year'] <= 2023)]

# Plotting the filtered data

plt.figure(figsize=(12, 6))  # Set figure
size

plt.plot(filtered_df['Year'], filtered_df['Oil price - Crude
prices since 1861 (current US$)'], marker='o', linestyle='-')

plt.title('International
Crude Oil Prices from 1970 to 2023')

plt.xlabel('Year')

plt.ylabel('Oil Price
(current US$)')

plt.grid(True)

plt.xticks(rotation=45)  # Rotate x-axis
labels for better readability

plt.tight_layout()
# Adjust layout

plt.show()  # Display the plot

Entity      Code  Year
Oil price - Crude prices since 1861 (current US$)

0  World  OWID_WRL
1861
3.082002

1  World  OWID_WRL
1862
6.604290

2  World  OWID_WRL
1863
19.812870

3  World  OWID_WRL
1864
50.695790

4  World  OWID_WRL
1865
41.449783```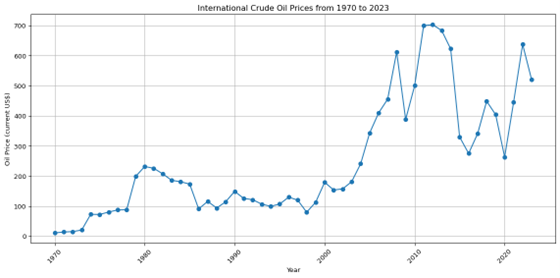
Placeholder TBC…
Text